Columbus, mapped
23 interactive maps built from the parcel-level public record — housing and affordability, development, transit, schools, city services, and environmental risk. Every map is searchable by address: find yours, then see how your neighborhood compares.
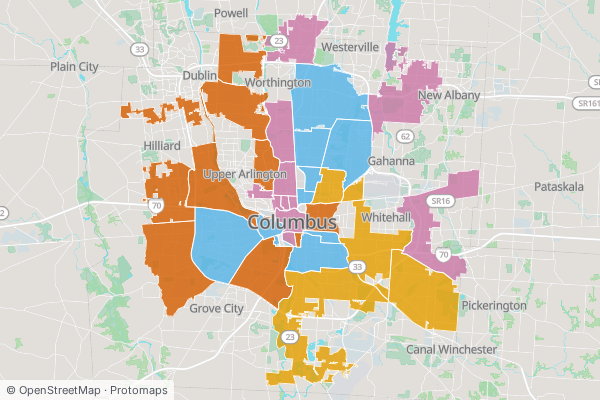
Displacement & gentrification pressure
Where are the signals of rapid neighborhood change stacking up?
Housing market & ownership
4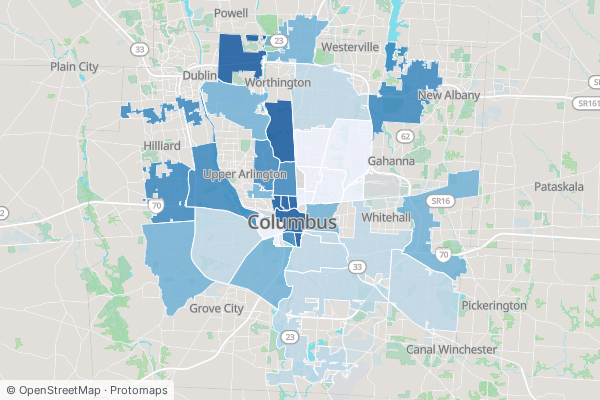
What did homes here recently sell for — and how fast is the market moving?
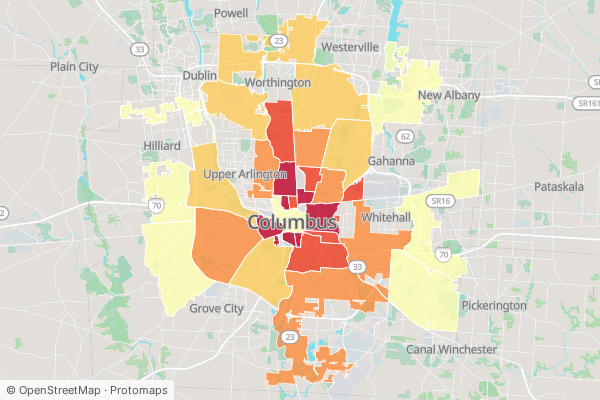
Where is the oldest housing — and the pre-1978 lead-paint risk?
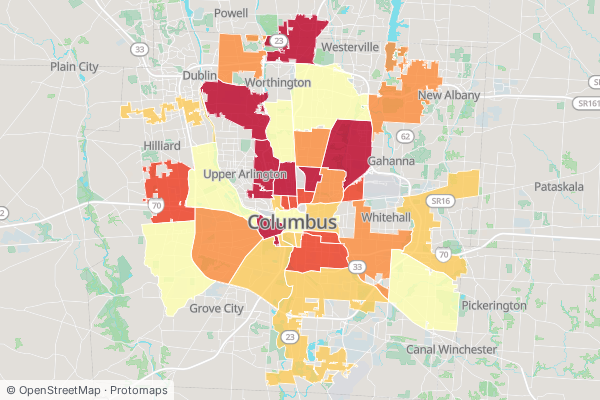
What share of homes are non-owner-occupied rentals?
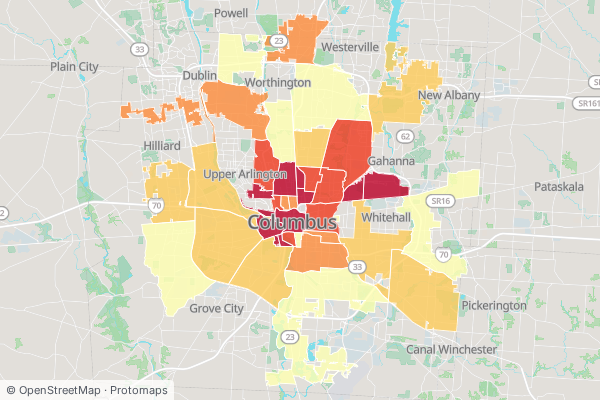
Where don't property owners live at what they own?
Affordability & assistance
3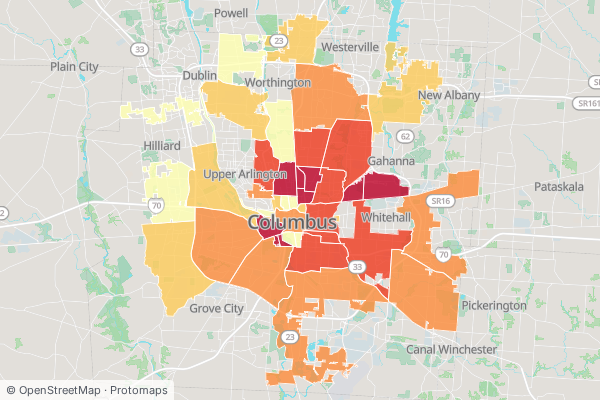
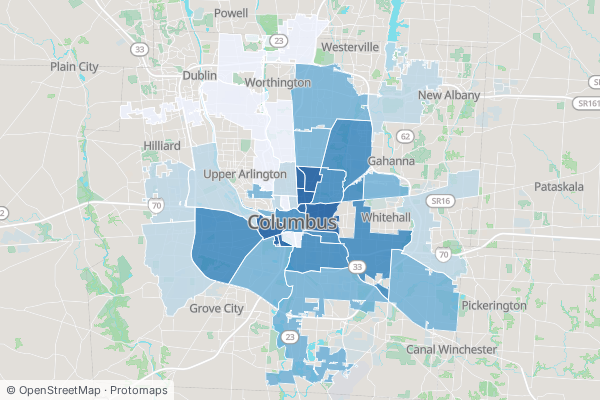
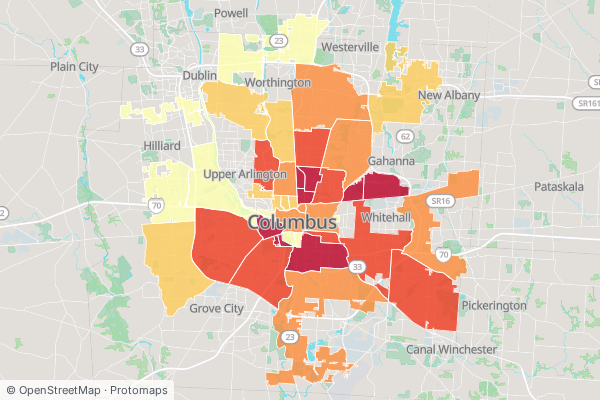
Development & land use
4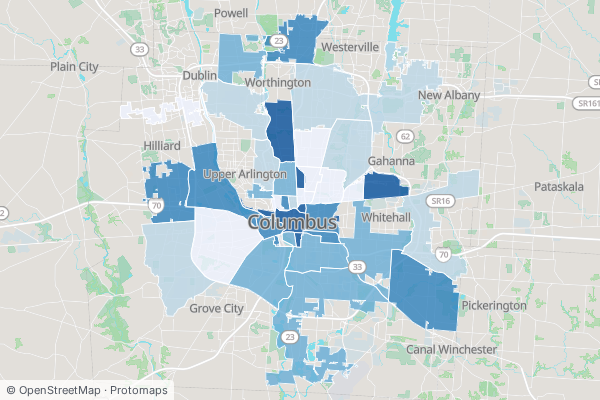
Where is construction and investment money flowing?
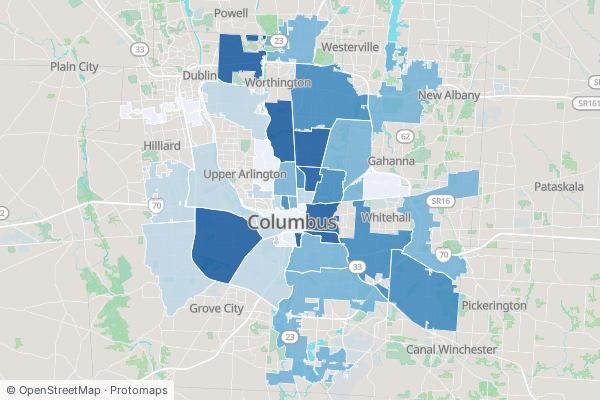
How much land is locked to single-family only?
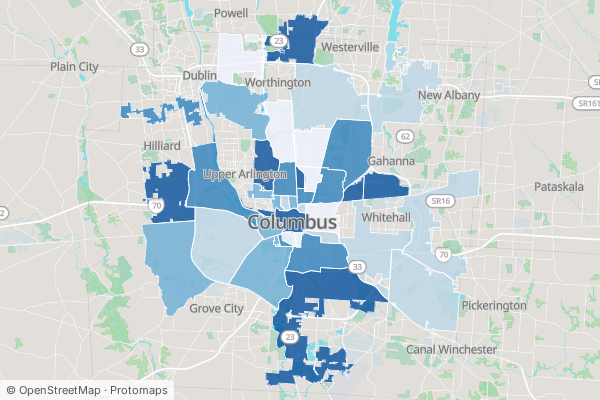
Which neighborhoods does the city propose to rezone — and to what?
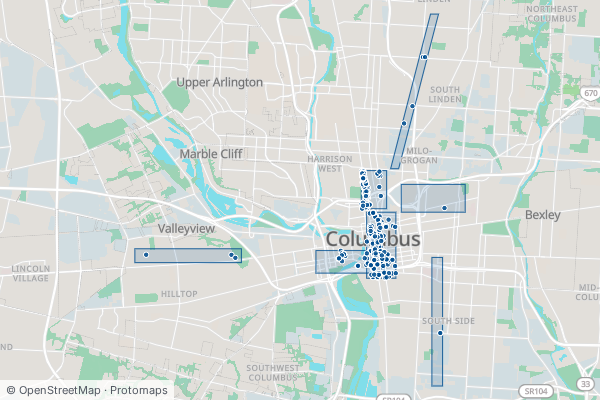
What's open — and what's vacant — along our main streets?
City services & blight
2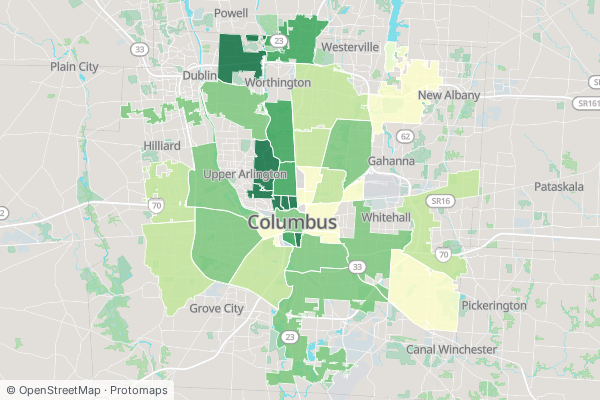
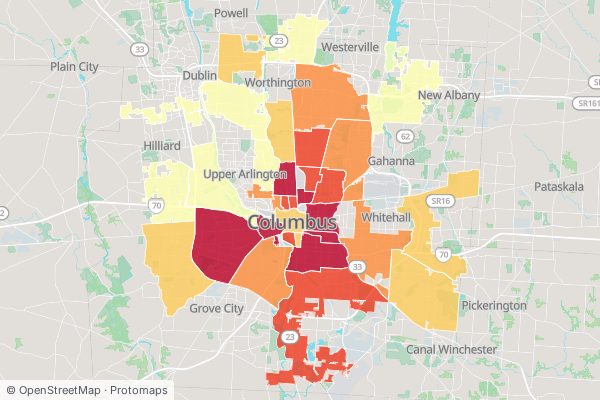
Getting around
3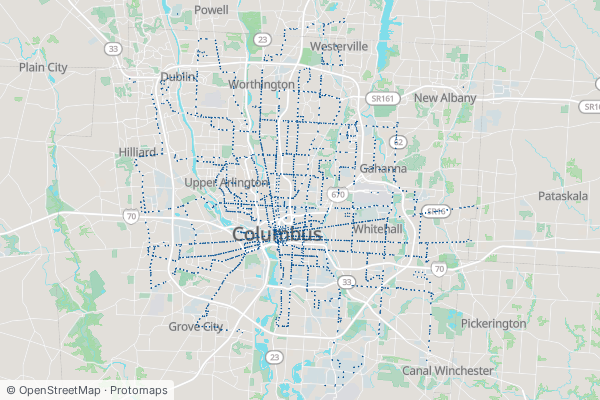
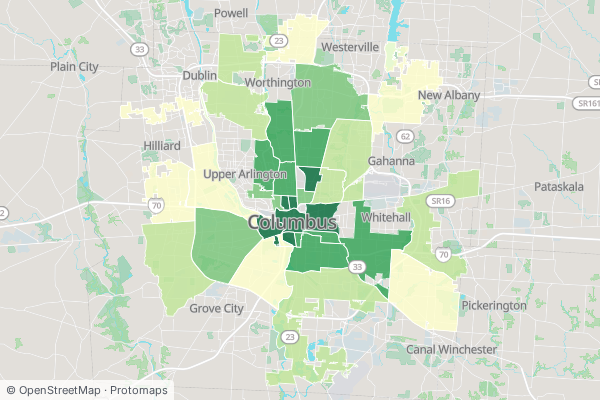
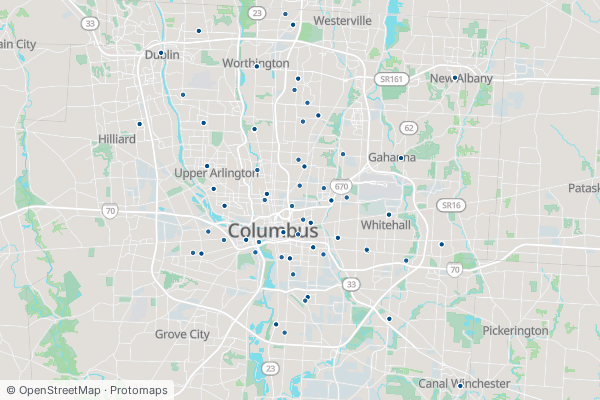
Schools & representation
2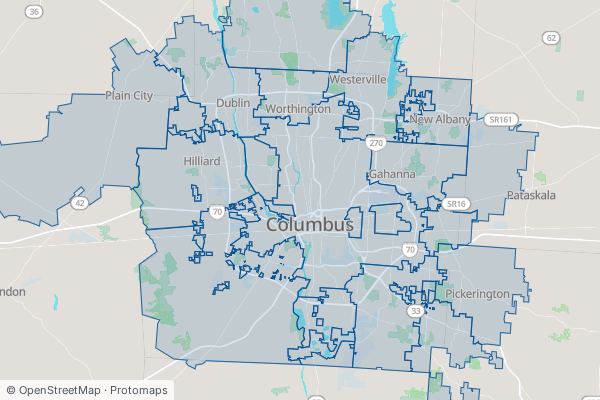
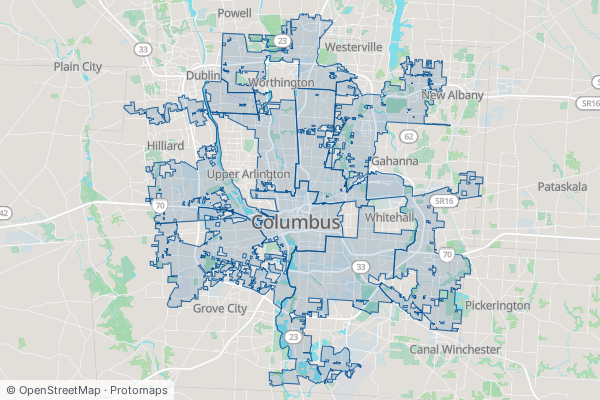
Environment & health
4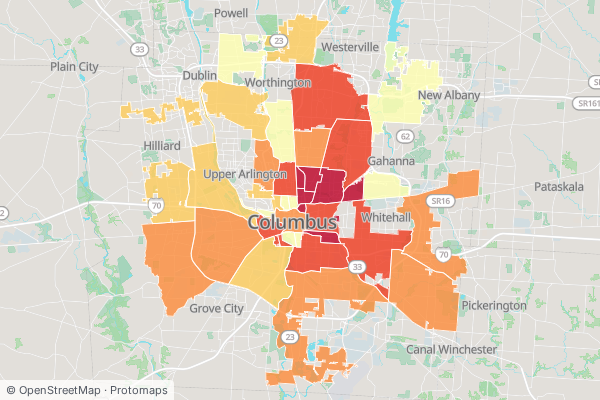
Where do environmental burdens and vulnerability stack up?
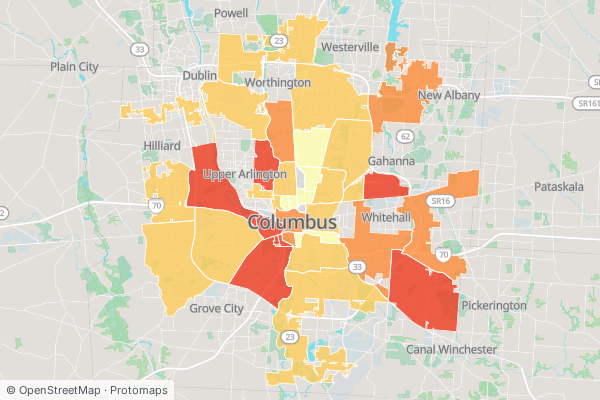
Which parcels sit inside a FEMA flood zone?
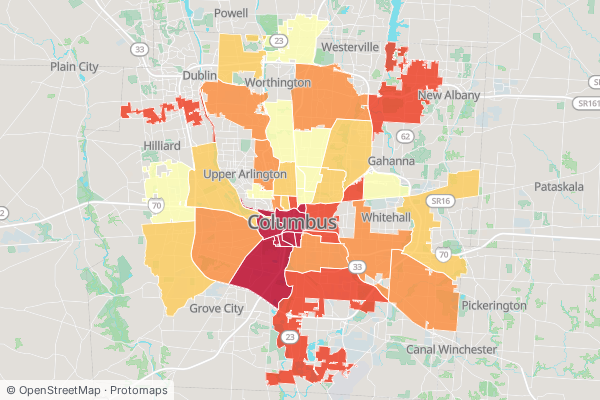
What natural hazards threaten this area most?
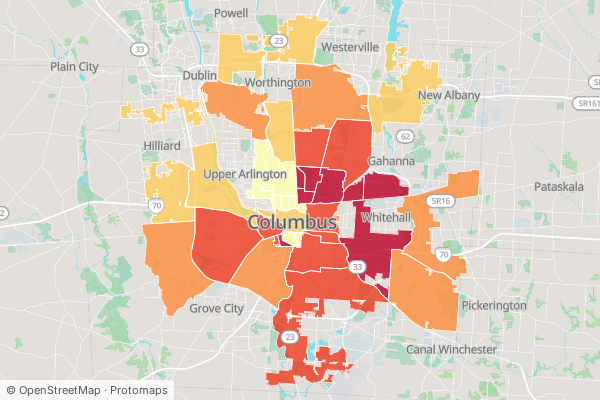
Where are chronic conditions like diabetes and asthma concentrated?
Also mapping Chicago: Chicago civic maps ↗ — the same views by community area and ward.