Chicago, mapped
Civic maps of Chicago from the City’s and Cook County’s own open data — every one resolved to the 77 community areas and 50 wards, with the source, the method, and the benchmark shown. More are being added.
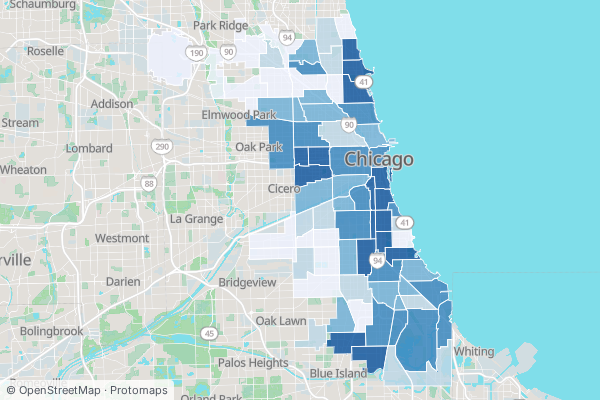
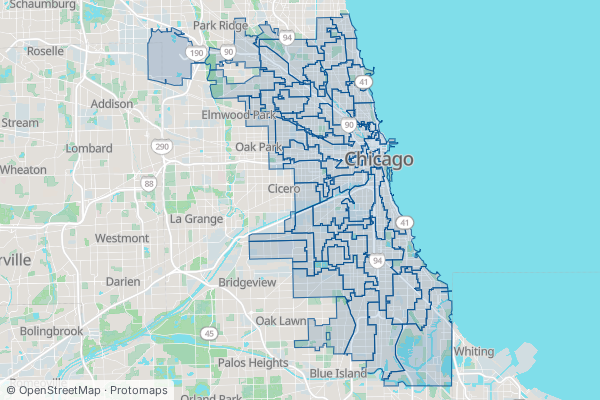
Where your property taxes go: TIF districts
Tax Increment Financing diverts about a billion dollars of property-tax growth a year. See how much of your community area sits inside a TIF — and how much it diverts.
Housing market & ownership
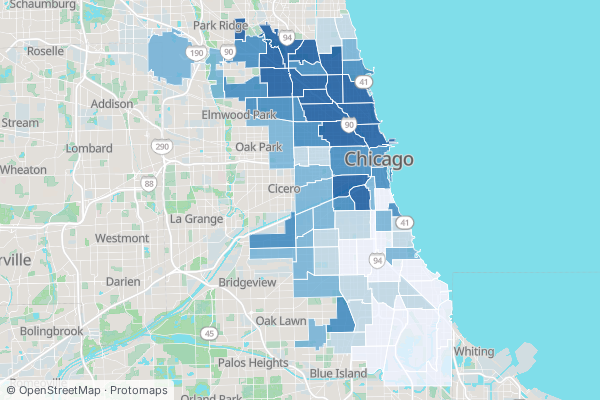
Development & land use
- Where your property taxes go (TIF districts)
How much of your community area sits in a TIF — and how much tax does it divert?
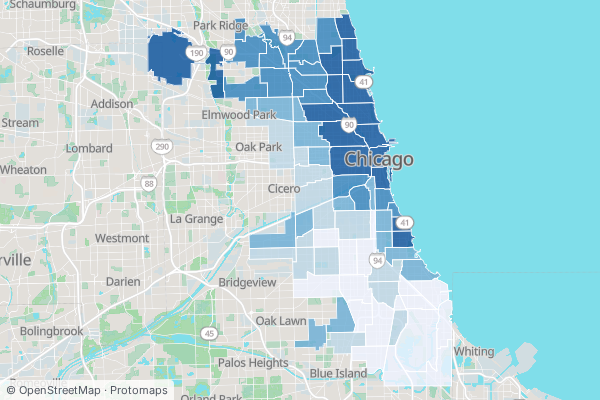 The appeal gap (assessment appeals)
Who contests their assessment, and who wins a reduction?
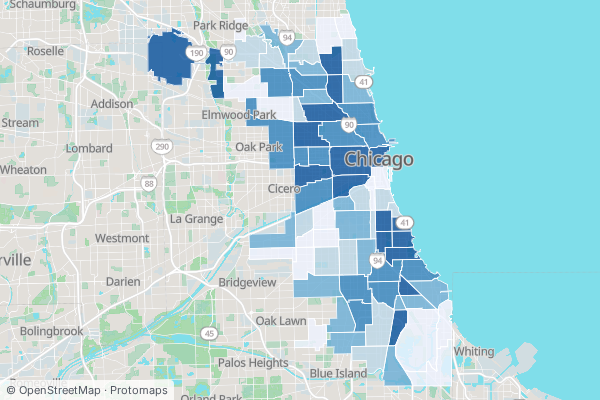 Development pulse (building permits)
Where is construction money flowing?
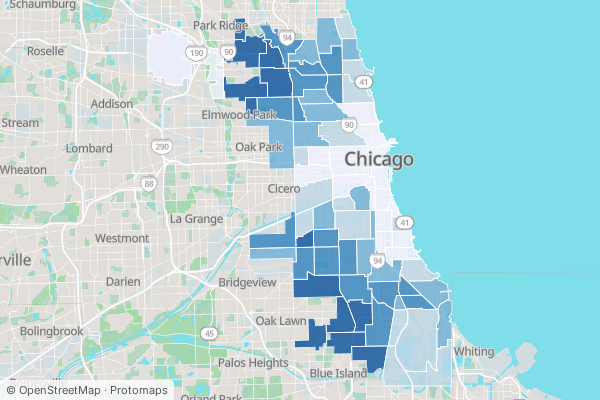 What can be built here (zoning)
How much of each community area is locked to single-unit houses?
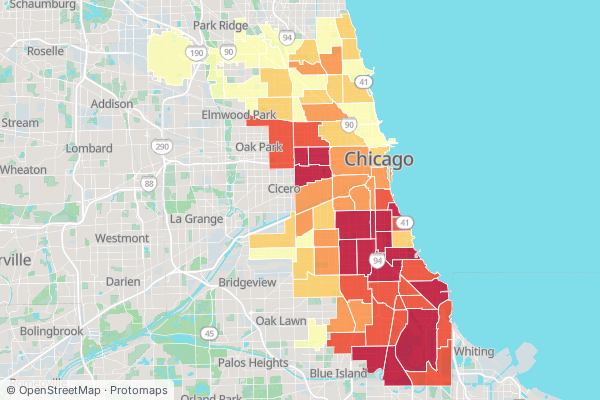 City-owned land (vacant lots for sale)
Where does the City own vacant land — and how much is for sale?
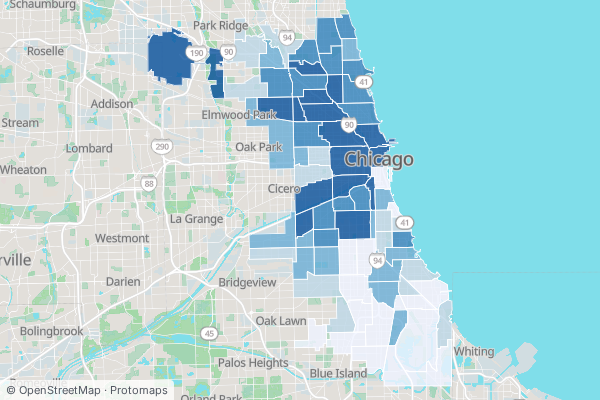 Storefront vitality (business licenses & churn)
Where is commerce concentrated — and which corridors are growing or thinning?
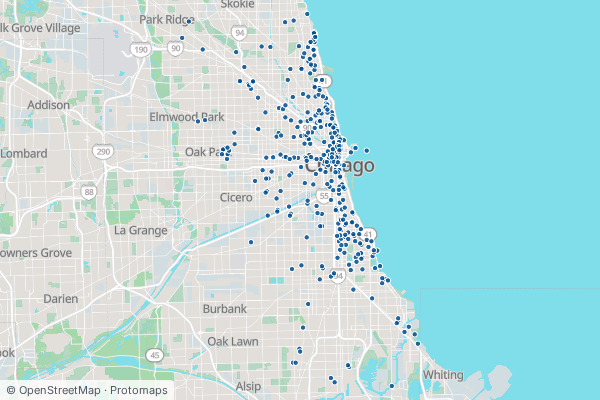 Individual landmarks
Where are Chicago’s designated landmark buildings — and who built them?
City services & blight
Democracy & representation
Everyday access
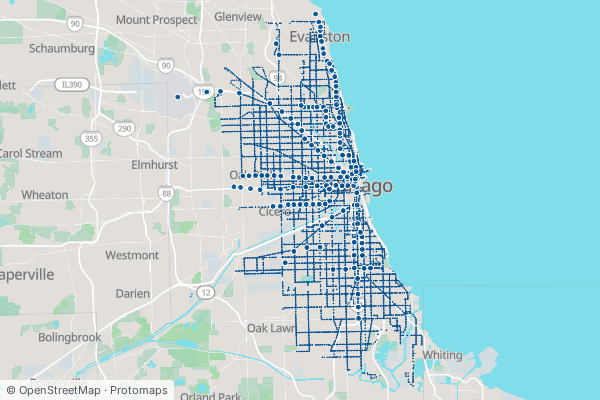 CTA frequency & the ‘L’
How often does service come near you — and which ‘L’ stations are step-free?
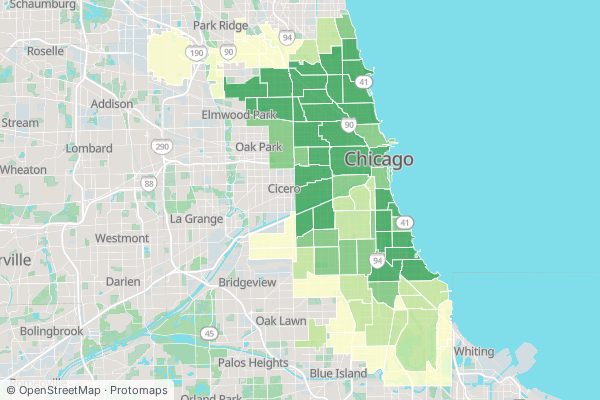 Transit access
How many homes are a short walk from frequent CTA service?
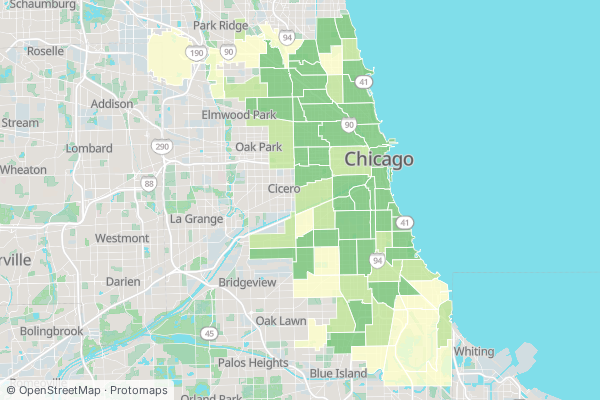 15-minute Chicago (libraries & parks)
How many homes sit within a short walk of a library or field house?
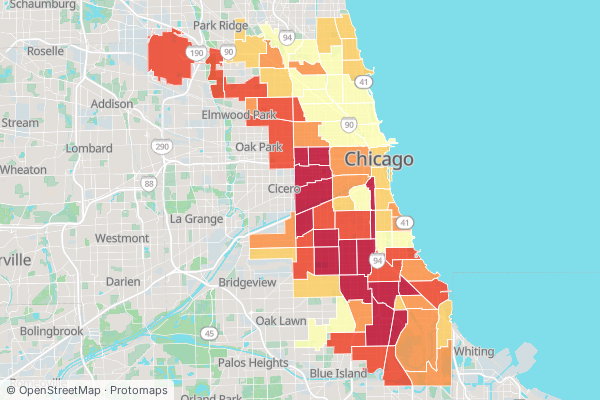 Digital divide (home broadband)
Which community areas have the most households without home internet?
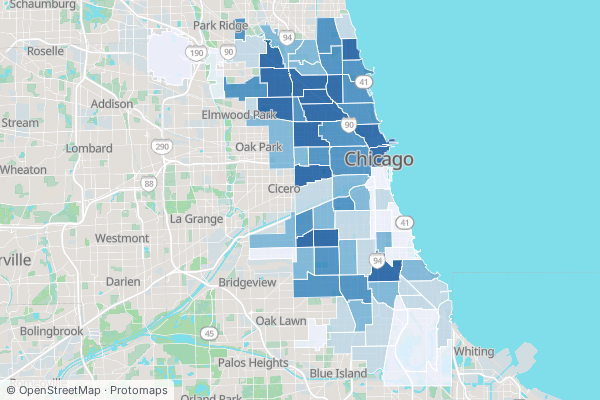 Speed & red-light cameras
Where are the cameras — and how many violations does each record per day?
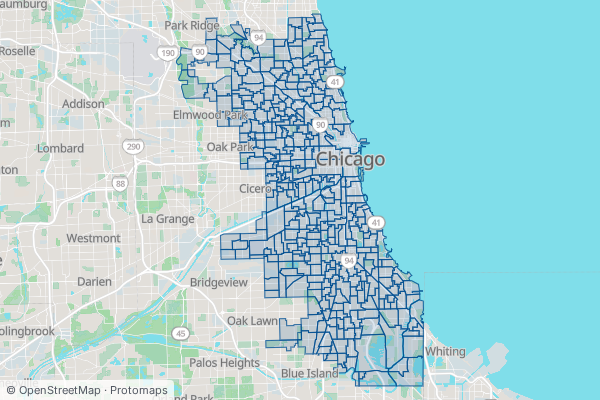 School attendance boundaries
Which neighborhood school is my address assigned to, and how is it rated?
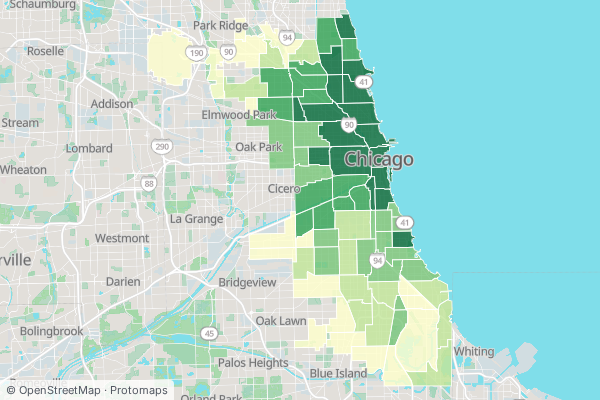 Divvy & bike access
Which neighborhoods can reach a Divvy station — and where are the docks?
Housing & affordability
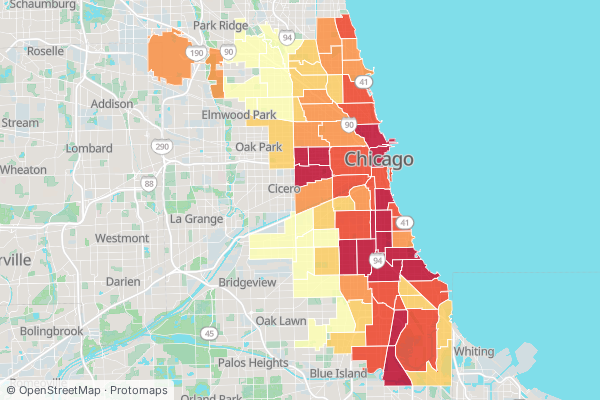 Owner-occupancy & investor concentration
What share of homes have an owner who lives somewhere else?
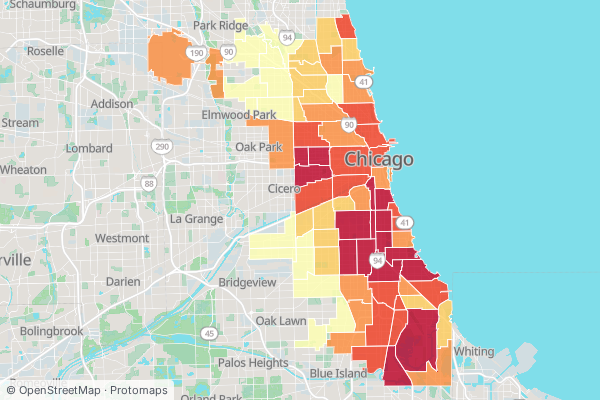 Absentee & out-of-state owners
Who owns the property here — and how far away do they live?
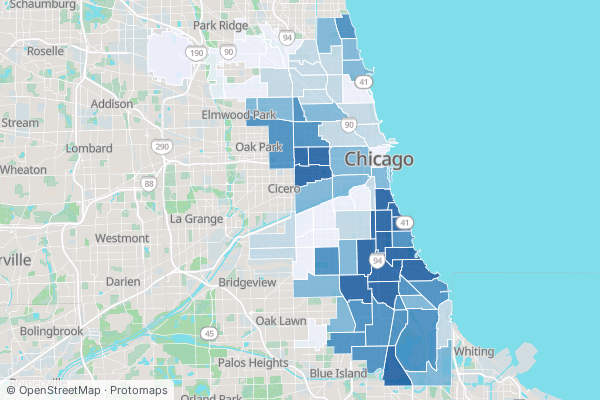 Subsidized & affordable housing
Where are vouchers and LIHTC units concentrated?
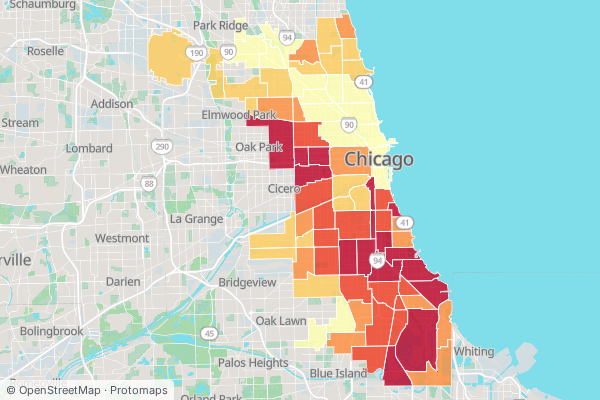 Rent burden
Where does fair-market rent eat the most of local incomes?
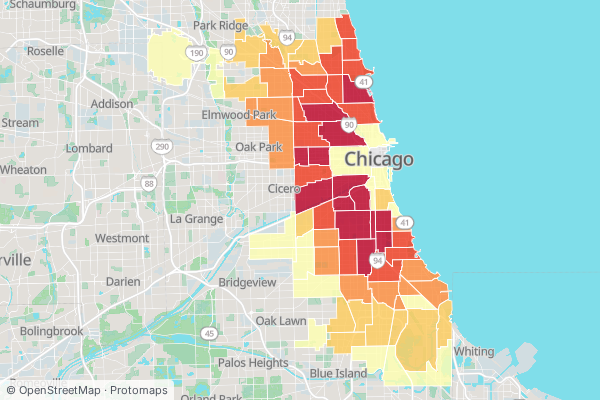 Aging housing stock
How old are the homes here — and where is lead-paint risk highest?
Health & environment
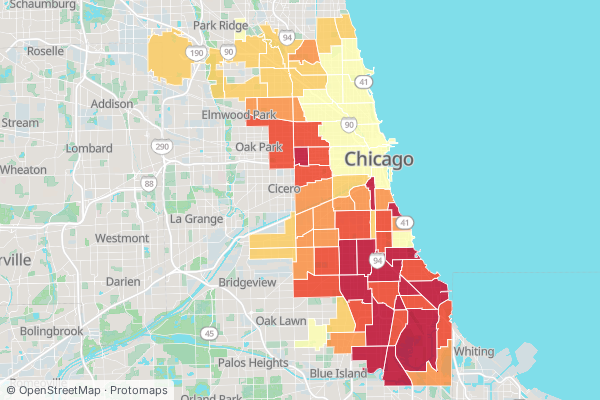 Neighborhood health outcomes
Where are chronic conditions concentrated across the city?
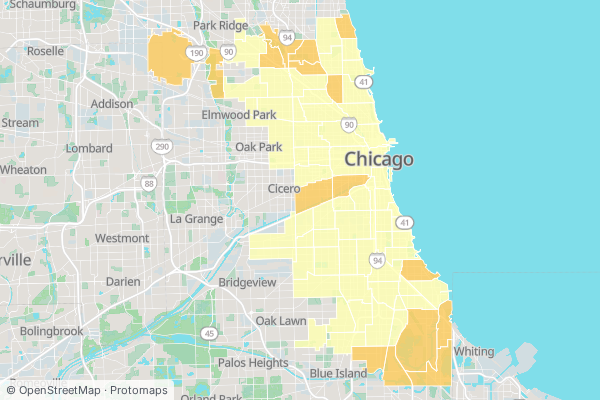 Floodplain exposure
Which community areas have the most parcels in a FEMA flood zone?
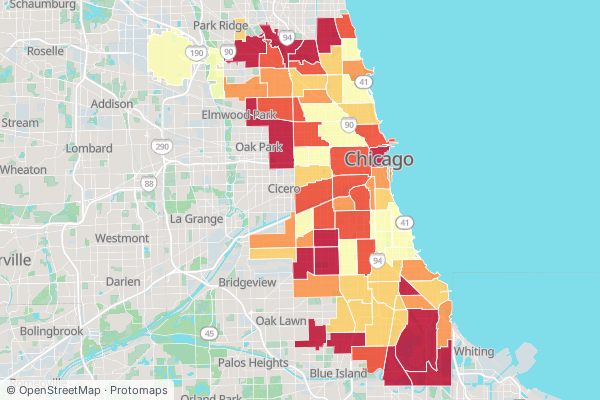 Natural-hazard risk (FEMA NRI)
Which natural hazards threaten each community area most?
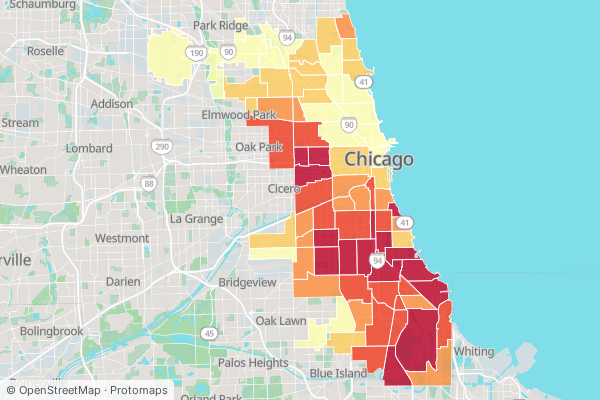 Environmental justice burden (EPA EJScreen)
Where do pollution burdens and vulnerability stack up?
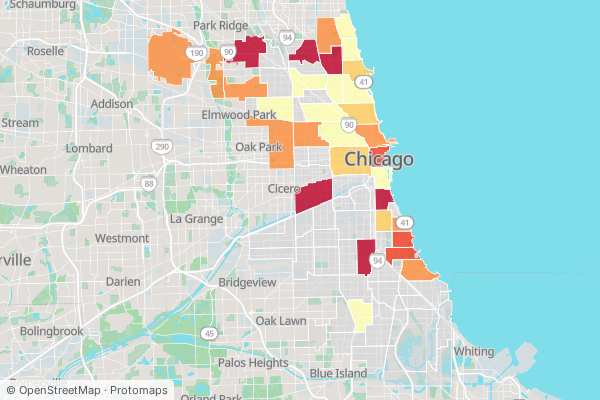 Large-building energy & emissions
How GHG-intensive and how well-rated are the big buildings here?
Also mapping Columbus: Columbus civic maps ↗ — the same views by neighborhood.