Could the Typical Household in Your Columbus Neighborhood Afford the Going Rent? How to Read the Rent Burden Map
Civic Worth's Columbus Rent burden map divides the annualized HUD fair-market rent by a neighborhood's ACS 5-year median household income, from 39.1% in Franklinton to 12.5% in German Village. Here is what that ratio measures, why it is not a count of cost-burdened renters or evidence of displacement, and how to read your neighborhood against the 30% line.
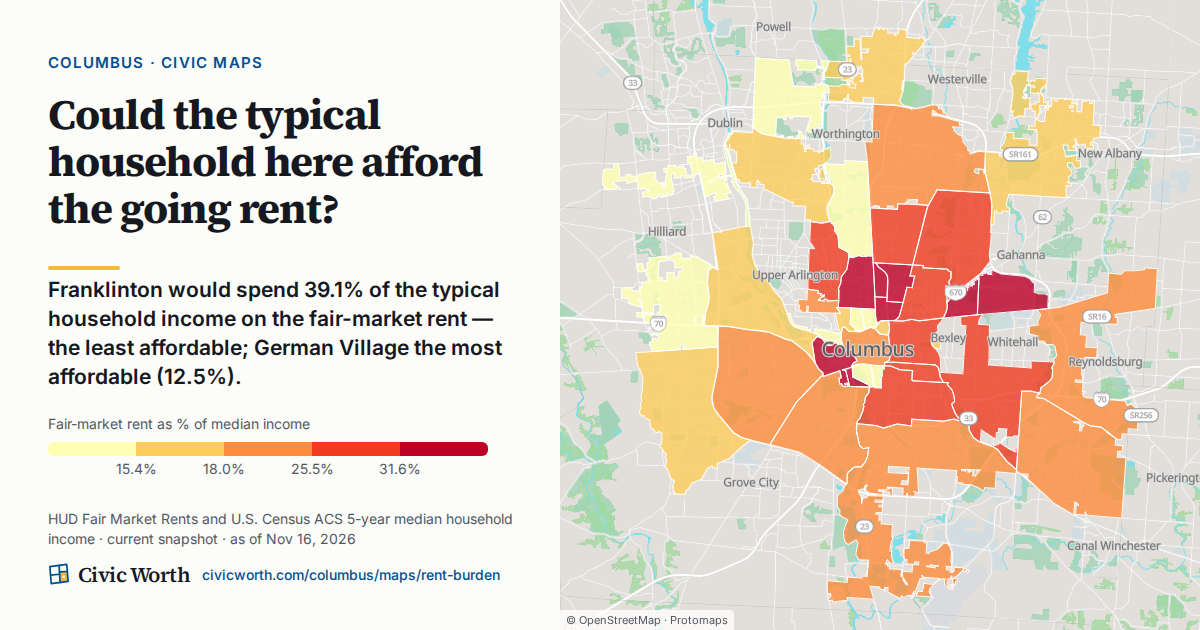
Franklinton would spend 39.1% of the typical household income on the fair-market rent, the least affordable; German Village the most affordable (12.5%). That is the current finding on Civic Worth's Columbus Rent burden map (Source: HUD Fair Market Rents and U.S. Census ACS 5-year median household income; current snapshot, as of 2026-10-26).
Two neighborhoods a short drive apart on either side of downtown, and a gap of more than 26 percentage points between them. It is a striking number. It is also easy to cite wrong, so before it lands in a funding proposal, a year-end housing story or an area-commission slide deck, here is exactly what it measures.
What the rent burden percentage actually divides
The map asks one question: could the typical household here afford the going rent? It answers with a single ratio.
On top: the HUD fair-market rent, annualized. On the bottom: the neighborhood's median household income from the Census Bureau's American Community Survey 5-year estimates. Divide the first by the second and you get a share. In Franklinton, that share is 39.1%. In German Village, 12.5%.
That is the whole calculation. One benchmark rent, one typical income, one percentage per place. You can open the Columbus Rent burden map and see every neighborhood ranked on it.
Why it is not a count of cost-burdened renters
Here is the plain answer to the question this map invites: no, the rent burden map does not tell you how many renters in a neighborhood are cost-burdened.
It is a ratio for a typical household, not a tally of people. It does not say how many renters on a block pay more than they can comfortably afford. It does not say which renters those are. It does not say what any one tenant actually pays. Nobody's lease went into this number.
If you are writing "39.1% of Franklinton renters are cost-burdened," stop. That sentence describes a different statistic entirely, one this map does not publish.
The two inputs, read carefully
The fair-market rent is one figure for the whole metro
The fair-market rent comes from HUD. It is HUD's estimate of a modest local rent, set once a year for the whole Columbus metro, so it is the same dollar figure everywhere on the map. It is a benchmark, not a price on a sign in a window, and actual rents in a given building can sit above or below it. The map's drawer shows each neighborhood's median gross rent, what renters there actually pay, and unlike the fair-market rent, that figure does vary from place to place. Treat the fair-market rent as the yardstick the map uses, not as what a unit on Sullivant Avenue costs this month.
The map also lets you switch bedroom size, from a studio to four bedrooms. The figures in this post are the map's default view.
Median household income is everybody, averaged over years
The denominator is median household income. Read the label closely: household, not renter. Owners and renters both sit inside that median. And it is an ACS 5-year estimate, which means it pools survey responses collected over 60 months. It is not this month's paycheck, and it will not reflect a raise someone got in September. On this map it is also area-weighted across the census tracts each neighborhood covers.
How to cite it
For reporters and grant writers, the safest phrasing is: "the share of the typical household income the fair-market rent would take." Then name the source (HUD Fair Market Rents and U.S. Census ACS 5-year median household income) and the as-of date shown on the map every time. If the date feels like a footnote, our post on why the as-of date on a Columbus record is the whole argument makes the case for keeping it in the sentence.
Why a high share alone does not show displacement
The map's data window is a current snapshot. A snapshot shows where the ratio is highest right now. It does not show whether the ratio is rising, and it does not show whether anyone is moving out.
Displacement is a story about change and movement over time. A single ratio at a single moment cannot carry that story by itself, no matter how high it is.
There is a second reason to be careful about what the ratio says. On this map the rent never changes from place to place, so a higher share means a lower median household income. The map's own notes call its pattern "really an affordability-of-income map." So when you see Franklinton, South Linden or Milo-Grogan near the top of the list, the map tells you the same metro rent takes a bigger bite of local paychecks there. It does not tell you why incomes there are lower, and neither should your copy unless a cited source does.
The same goes for the language. These are neighborhoods with the highest and lowest share. Not the worst, not struggling, not anything else. (We make the same point about a different number in what a sale-price gap between neighborhoods does and doesn't mean.)
How to read the map for your neighborhood
Here is the practical part, and it takes about two minutes.
Step 1: Find your place
The map ranks all 41 Columbus neighborhoods, from Near East and Greater Hilltop to Clintonville, Italian Village, Hayden Run and the Brewery District. Search your address or click a neighborhood, then note its share. One row is named State of Ohio: it is one of the 41 neighborhoods in the ranking, not a statewide figure, so don't read it as an Ohio average.
Step 2: Compare it with the 30% line
The map marks 30% as the classic "rent-burdened" line. Is your neighborhood's share above it or below it? Read the answer as "the fair-market rent would take more (or less) than 30% of the typical household's income here," not as a count of burdened renters. That single comparison is often more useful in a funding application or a news story than the raw percentage, because it gives readers a frame of reference they did not have to calculate.
Step 3: Compare with neighbors, not just extremes
Franklinton and German Village are the two places the map's headline names, but the full ranking has one place above Franklinton: Harmon Road Corridor, at 54.0%. Far Northwest ties German Village at the bottom, at 12.5%. Most readers live somewhere in the middle. Comparing North Linden with Northland, or Westland with Far West, often tells a more useful local story than the top and bottom of the list.
Step 4: Add parcel-level context
The rent burden map works at the neighborhood level. If you want to know what a single address means, use Civic Worth's Columbus property records lookup. Type a Columbus address to resolve it to its Franklin County parcel, with its parcel number, zoning and council district. It also joins recent 311 activity and building permits. (For what that 311 history can and can't tell you, see what Columbus 311 response times actually measure.)
Verified newsrooms and 501(c)(3) nonprofits get 100 reports a month at no cost, which helps when a housing story or a grant proposal needs context for more than one address.
The better question to ask next
Once you know what the ratio is, the interesting questions get sharper. Is your neighborhood's share above or below the 30% line? Which nearby places sit closest to yours? And if a share looks high, what data beyond a snapshot would you need before calling it a trend? Columbus deserves numbers that are cited as carefully as they are quoted. Go back to the Rent burden map, find your neighborhood, and start there.
Sources
- Civic Worth, Columbus Rent burden map
- U.S. Census Bureau, ACS 1-year and 5-year estimates
- Civic Worth, The Date on a Columbus Zoning or District Record
- Civic Worth, Columbus property records
- Civic Worth
Drafted with AI assistance from public records, and checked against the sources above before publishing.
Frequently asked
Is rent burden on the Civic Worth map the same as the share of cost-burdened renters?
No. The Columbus Rent burden map divides one HUD fair-market rent by a neighborhood's ACS 5-year median household income. It is a ratio for a typical household, not a count of people. It does not say how many renters pay more than they can afford, which renters they are, or what any tenant actually pays.
Does a high rent burden share mean a neighborhood is experiencing displacement?
Not on its own. The map is a current snapshot, so it shows where the ratio is highest now, not whether it is rising or whether anyone is moving out. And because the fair-market rent is one figure for the whole Columbus metro, a high share on this map reflects a lower median household income, not a higher rent.
How do I read my Columbus neighborhood's rent burden?
Open the Columbus Rent burden map, find your neighborhood among the 41 ranked, and check whether its share is above or below the 30% line the map marks as the classic rent-burdened threshold. Then compare it with nearby neighborhoods. Cite it as the share of typical household income the fair-market rent would take, with the source and as-of date.