Why a $660,000 Median in Lincoln Park and $71,000 in Riverdale Isn't the Whole Story
Chicago's sale-price map shows a median $660,000 in Lincoln Park versus $71,000 in Riverdale; this post walks through how to read that gap properly, by checking the building, the zoning, and the wider pattern instead of treating one number as an explanation.
What a $660,000 median in Lincoln Park and $71,000 in Riverdale actually means
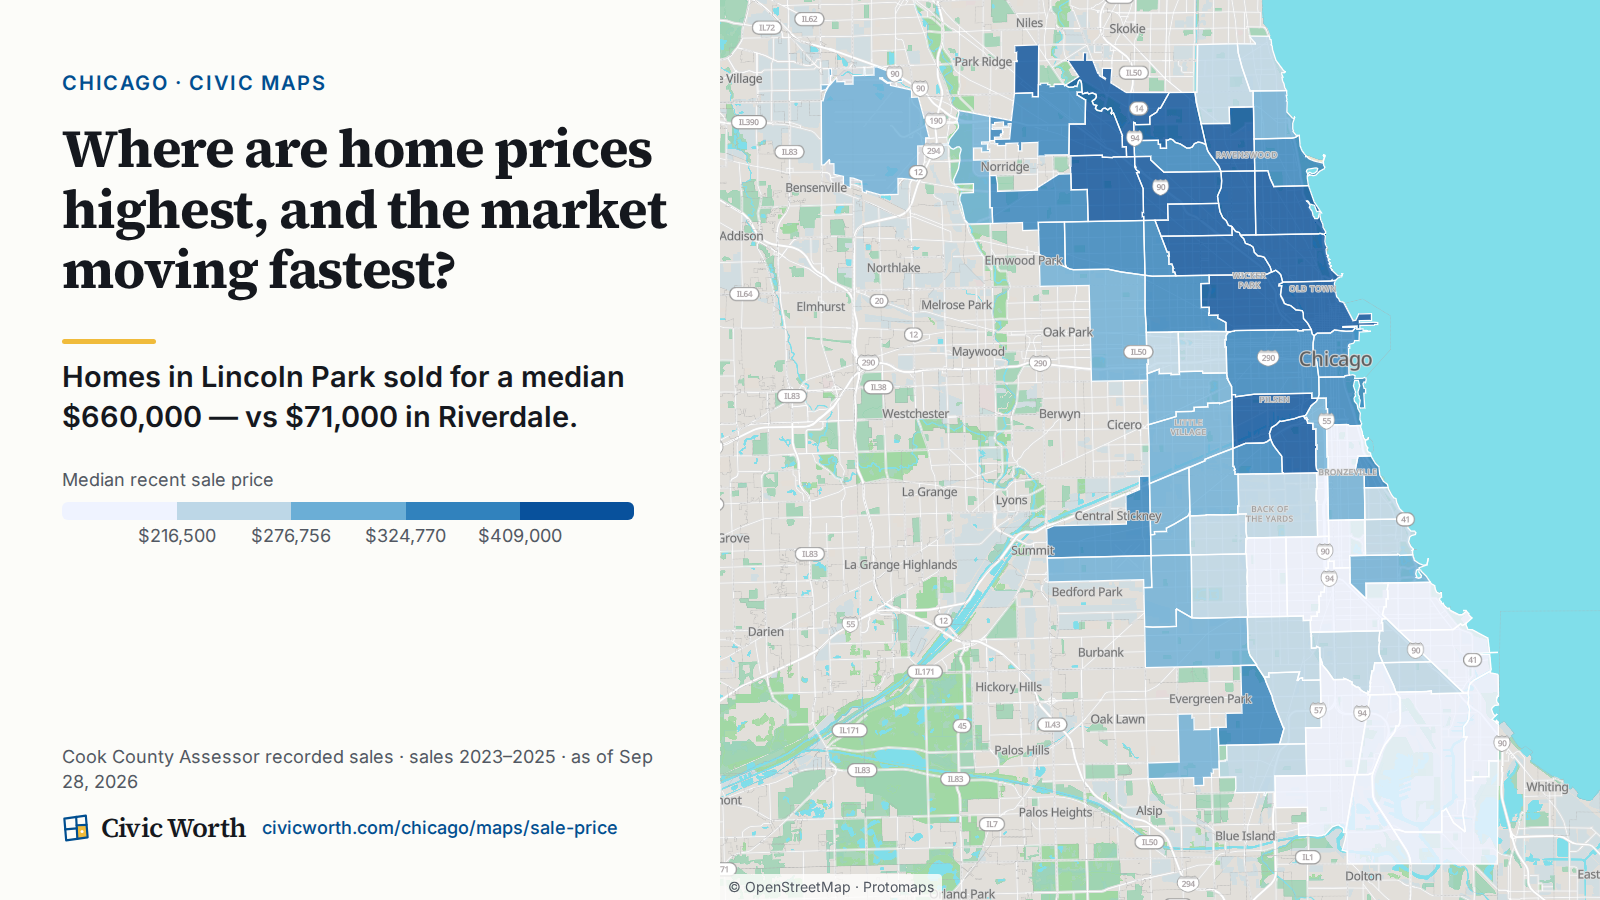
Homes in Lincoln Park sold for a median $660,000, versus $71,000 in Riverdale, according to Cook County Assessor recorded sales from 2023 to 2025, as tracked on Civic Worth's sale-price map as of October 8, 2026. That's not a typo and it's not a coincidence.
The number itself is simple. What it means is not. A median is the middle price among a community area's arm's-length sales in the window, here 2023 to 2025, so a single figure like $660,000 sits on top of many different sales: condos and single-family homes, renovated and not, big lots and small ones. The gap between Lincoln Park and Riverdale is real and it's worth asking about. It is not, on its own, an explanation of anything.
Why one sale price can't tell you what you want to know
Say a parcel in your reporting area, or your own block, sold for way more or way less than you expected. The instinct is to ask "is that a good deal" or "is this neighborhood on the way up." Civic Worth doesn't answer either question, on purpose: a sale price is a fact about one transaction, not a judgment about a place.
What the sale-price map is built to do is show you the pattern around that transaction, so you can check whether the outlier is the building, the zoning, or something wider than either.
The Housing market heat (sale prices) map ranks every Chicago community area by median sale price (2023-25 and 2020-22), the change between those windows, and sales velocity, all from Cook County Assessor arm's-length sales. It's the first stop. It is not the whole investigation.
How to actually read the gap: a three-step check
Step 1: Compare the community area to its neighbors, not to the whole city
Lincoln Park versus Riverdale is a dramatic comparison, and that's exactly why it's a bad way to judge any single property. A parcel in Riverdale is better read against Riverdale's own median and sales velocity, and against the community areas that border it, than against a North Side market. Pull up the map, find the community area in question, and look at who's sitting next to it before you draw any conclusion.
Step 2: Check what the zoning actually allows
Cross-reference the sale price against Chicago's zoning map, which looks up the zoning district for any address under the Chicago Zoning Ordinance (Title 17). If a high sale sits on a lot zoned for more density than what's currently built, that's a different story than a high sale on a lot that's already built to capacity.
Step 3: Pull the parcel's own record
The last step is the specific address. Civic Worth's free Civic Address Card shows who represents a Chicago parcel, how it's zoned, the nearest transit, and the most recent 311 requests nearby, in under a second, and that's the level a single sale price needs to be checked against.
What the map does not tell you, and never will
This is worth being blunt about, because it's where sale-price data gets misused most often.
The sale-price map does not explain causation. It can show that a community area's median sale price moved between 2020-22 and 2023-25; it cannot tell you why, and Civic Worth won't guess. It can surface a geographic pattern, including one that might track with disinvestment, without diagnosing that pattern or assigning it a cause. That's a job for reporting, not for a parcel database.
The map also does not rank neighborhoods as good or bad. It ranks community areas by median price, price change and sales velocity, and "highest" and "lowest" there describe recorded sales, not places. A low median is not a verdict on a place; it's a record of what sold there, for how much, in a specific window.
And a median sale price is not a prediction. Three years of recorded sales tell you what happened. They do not tell you what will happen to a specific property next year, and Civic Worth does not forecast property values, full stop.
What to do next, depending on who you are
A reporter chasing a development story should check the sale-price trend against the TIF map and the zoning map for the same community area before writing that a neighborhood is "hot."
A nonprofit building a grant narrative around disinvestment should compare several adjacent community areas side by side on the sale-price map rather than citing one number in isolation; the pattern across a cluster of areas is more defensible than a single median.
A prospective buyer sanity-checking a listing price should look up the community area's median and sales velocity, then look up the address's zoning district on the zoning map before treating the asking price as the market rate.
A planner or policy researcher can use the sale-price map and the zoning map together to compare a community area's prices with the zoning districts of the parcels in it.
Open the Housing market heat (sale prices) map, find your community area (or the one you're reporting on), and compare it to its neighbors before you treat one sale price as the whole story.
Sources
- Civic Worth, Housing market heat (sale prices) map
- Civic Worth, Chicago Zoning Map
- Civic Worth, home page
- Civic Worth, Chicago TIF districts map
Drafted with AI assistance from public records, and checked against the sources above before publishing.
Frequently asked
Why do sale prices vary so much between Chicago neighborhoods?
A median sale price reflects every arm's-length sale in a community area over a set window, so it mixes lot size, building condition, zoning capacity, and how many sales happened at all. Civic Worth's sale-price map shows the pattern (Lincoln Park's median was $660,000 versus Riverdale's $71,000, Cook County Assessor recorded sales, 2023-2025) but doesn't explain why; that takes checking the zoning and parcel record underneath.
How do I know if a home's listing price is fair for its block?
Start by comparing the community area's median on Civic Worth's sale-price map to its neighbors, then pull the specific address's civic profile to see its zoning district and recent permit history. A price that's far outside its own community area's range deserves a second look at the parcel, not just the market.
Does a low median sale price mean a neighborhood is a bad investment?
No. Civic Worth doesn't rank neighborhoods as good or bad, and a median sale price is a record of past transactions, not a prediction. A low median can reflect smaller lots, older building stock, zoning that caps what can be built, or simply fewer recorded sales in the window; the map surfaces the pattern, it doesn't diagnose the cause.