The Appeal Gap: 85.4% in the Loop, 3.5% in West Englewood, and Where Gage Park and Albany Park Fall
Civic Worth's Chicago appeal gap map shows the Loop appealed the most (85.4% of parcels) and West Englewood the least (3.5%) for tax year 2024. This post explains how the appeal share is calculated and where Gage Park and Albany Park rank, ahead of Chicago's 2027 reassessment.
Loop appealed the most (85.4% of parcels); West Englewood the least (3.5%). That is the current finding on Civic Worth's Chicago appeal gap map, from the Cook County Assessor's appeals data for tax year 2024, as of October 26, 2026.
Sit with those two numbers for a second. Same county. Same assessor. Same tax year. In one community area, most parcels had an appeal on file; in the other, about one in thirty did. The map asks a plain question, who contests their assessment, and who wins a reduction?, and this post walks through how to read its answer for Gage Park, Albany Park, or wherever your own bill lands.
What the appeal share actually measures
Start with the unit. A parcel is one lot on the county's books: one piece of land with its own property index number. If you want the long version, here is what a 14-digit PIN knows about your property.
An assessment appeal is the neighborly version of "I think you got my number wrong." The Cook County Assessor puts a value on each parcel for tax purposes, and an owner who disagrees can formally ask for it to be reconsidered. Property owners can file an appeal with the Assessor's Office and at the Board of Review. The map does not walk through that process. It counts one result: whether a parcel had an appeal on file with the Assessor.
So the measure is a share: of all the parcels in a community area, what percentage had an appeal on file for tax year 2024. A share puts big and small areas on the same scale, which a raw count never could. The Loop's 85.4% is not "lots of appeals because lots of buildings." It is the share of its parcels that appealed.
You can open the Chicago appeal gap map and see every community area ranked on that share.
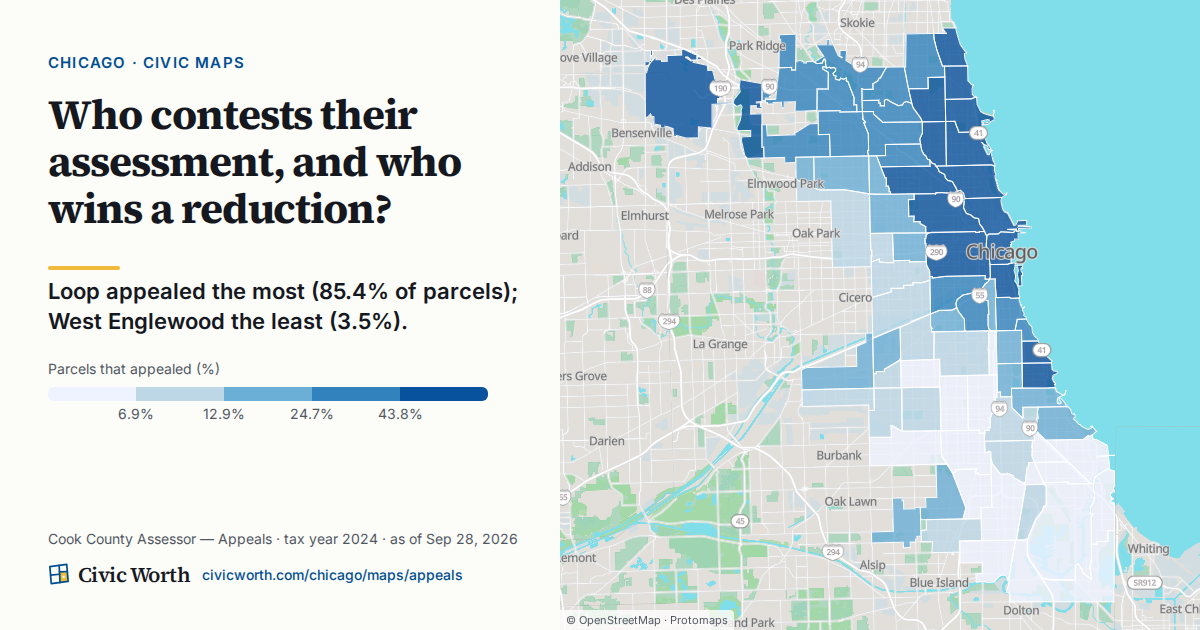
How to find Gage Park and Albany Park on the map
The map's full ranking lists all 77 community areas, from the Loop at the top to West Englewood at the bottom. Search your address or click any community area to see its share.
In the tax year 2024 ranking, Albany Park is 22nd of 77, with 39.0% of its parcels appealed. Gage Park is 68th, at 6.3%, nine places above West Englewood. Check the map itself before you quote either number.
A useful habit: read each place against both endpoints. Ask how far Albany Park is from 85.4%, and how far Gage Park is from 3.5%. That framing keeps you honest about scale. A community area near the bottom of the list is not "bad at appealing," and one near the top is not "winning." The map says as much: a high rate can mean an engaged neighborhood or an active tax-appeal industry, so it reports the rate rather than judging it.
Two more columns worth checking
Filing is only half of the map's question. The map also shows, by community area, the success rate and the median reduction. Success rate is the share of appealed parcels that won a reduction, so a high filing share with a modest success rate tells a different story than a low filing share with a high one. Look at all three before you write a sentence about any neighborhood.
One caution for places with few appeals: where a community area has fewer than 25 appealed parcels in a year, the map leaves out its success rate and median reduction, so a thin count can't read as a misleading 0% or 100%.
The map covers tax years 2021 through 2025, with 2024, the most recent complete year, shown by default. Switching years shows whether a community area's position is steady or moves around.
What the map does not tell you
This is the part we would underline twice.
The map does not explain why filing rates differ. It shows that they do. Its drawer does show who filed: the split between appeals filed by an agent or attorney and those filed by the owner directly. Any other reason you have heard (building type, outreach, owner-occupancy, awareness) is a hypothesis until a cited source backs it, and the map is not that source.
It does not predict anyone's tax bill or home value. An appeal share is a record of what owners filed, not a forecast.
And it does not rank neighborhoods on quality. "Most" and "fewest" are the only words the data earns. If you want a parallel lesson in reading a gap without over-reading it, see why a $660,000 median in Lincoln Park and $71,000 in Riverdale isn't the whole story.
The reporting angle: a documented starting question
For a reporter or a nonprofit doing property-tax outreach, the gap between 85.4% and 3.5% is not a conclusion. It is a question with a source and a date on it, which is the best kind of question to start a story or a program with.
The map gets you to the area. The follow-up lives at the parcel. Verified newsrooms and 501(c)(3) nonprofits get 100 reports a month at no cost, which is enough to look closely at a sample of addresses in Gage Park or Albany Park rather than guessing from a share.
If your story stretches past filing into how a value moves from the assessor's notice through later stages, our guide on how to read your block's appeal pipeline picks up there.
Why look now, before the 2027 reassessment
The Cook County Assessor reassesses property on a three-year cycle, and the City of Chicago's reassessment years are 2024 and 2027. So tax year 2024, the map's default, was itself a Chicago reassessment year, and the next one is 2027. Knowing where your area sat in 2024 gives you something concrete to compare against when the new numbers arrive.
The practical order is simple. Find your community area's share on the map first, so you know the context. Then look at your own parcel: Civic Worth's Chicago property records lookup resolves an address to its 14-digit PIN, then shows its assessed and equalized value, its classification and where it sits in the assessment-appeal pipeline.
So here is the one thing to do this week: go back to the appeal gap map, select Gage Park, Albany Park, or your own community area, and see which end of the 85.4%-to-3.5% range your neighbors are closer to.
Sources
- Civic Worth, Chicago appeal gap map
- Civic Worth, What a 14-Digit PIN Knows About Your Property
- Cook County Assessor, The Cook County Property Tax System
- Cook County Assessor, Assessment and Appeal Calendar
- Civic Worth
- Civic Worth, How to Read Your Block's Appeal Pipeline
- Civic Worth, Chicago property records
Drafted with AI assistance from public records, and checked against the sources above before publishing.
Frequently asked
How is the property tax appeal share calculated in Chicago?
On Civic Worth's appeal gap map, the share is the percentage of a community area's parcels that filed an appeal with the Cook County Assessor in the selected tax year, from the Assessor's open appeals data. The map covers tax years 2021 through 2025 and shows 2024, the most recent complete year, by default.
Where do Gage Park and Albany Park rank for assessment appeals?
In the map's tax year 2024 ranking of 77 community areas, Albany Park is 22nd, with 39.0% of its parcels appealed, and Gage Park is 68th, at 6.3%. The Loop appealed the most (85.4%) and West Englewood the least (3.5%). Check the map for the current figures before you quote them.
Does a high appeal share mean lower taxes in that neighborhood?
No. The appeal share records how many parcels filed, not what anyone's bill will be. The map separately shows the success rate and median reduction, but it does not predict tax bills or home values and does not explain why filing rates differ. Treat the gap as a starting question to investigate at the parcel level.