Reading the Chicago Ward 2 Page: What a Rate, a Median and a Rank Actually Measure
A plain-language guide to the three ward-wide figures on Civic Worth's Chicago Ward 2 page (as of Nov 20, 2026): what a per-1,000-parcel rate, a filtered 311 median and a rank of 50 actually measure, and how to get from a ward number to a single parcel.
Chicago's Ward 2 page reports three ward-wide figures, dated Nov 20, 2026: 41.7 building permits per 1,000 parcels, a 0.5-day median to close 311 requests, and 25.4 building-code violations per 1,000 parcels. If you cover Lincoln Park or the Near North Side, those are the numbers you will be tempted to drop into a year-end story. Good. Just know what each one counts first.
Open the Chicago Ward 2 page alongside this post. Every time you quote one of its numbers, quote the as-of date with it. The data behind the page is subject to change at any time, so the page you open may show slightly different values than the ones here. A number without a date is a rumor with decimals.
The three numbers on the Ward 2 page
Here is what the page showed as of Nov 20, 2026:
- Development pulse (building permits): 41.7 permits per 1,000 parcels, +20% vs city, #7 of 50.
- 311 median days to close (within 30 days): 0.5 days, -38% vs city, #45 of 50.
- Code violations & blight pressure: 25.4 building-code violations per 1,000 parcels, -47% vs city, #37 of 50.
The page lists two community areas under Ward 2: Lincoln Park and the Near North Side. It does not say why Ward 2 lands where it does on any of these, so this post will not either.
For a neighboring measure, the Vacant & abandoned buildings map answers a related question: where do residents report vacant and abandoned buildings? Its current finding, verbatim: "West Englewood has the most vacant-building complaints (25.3 per 1,000 parcels) over the trailing 365 days; O'Hare the fewest (0.0)." Source: City of Chicago 311 service requests, trailing 365 days, as of 2026-11-20.
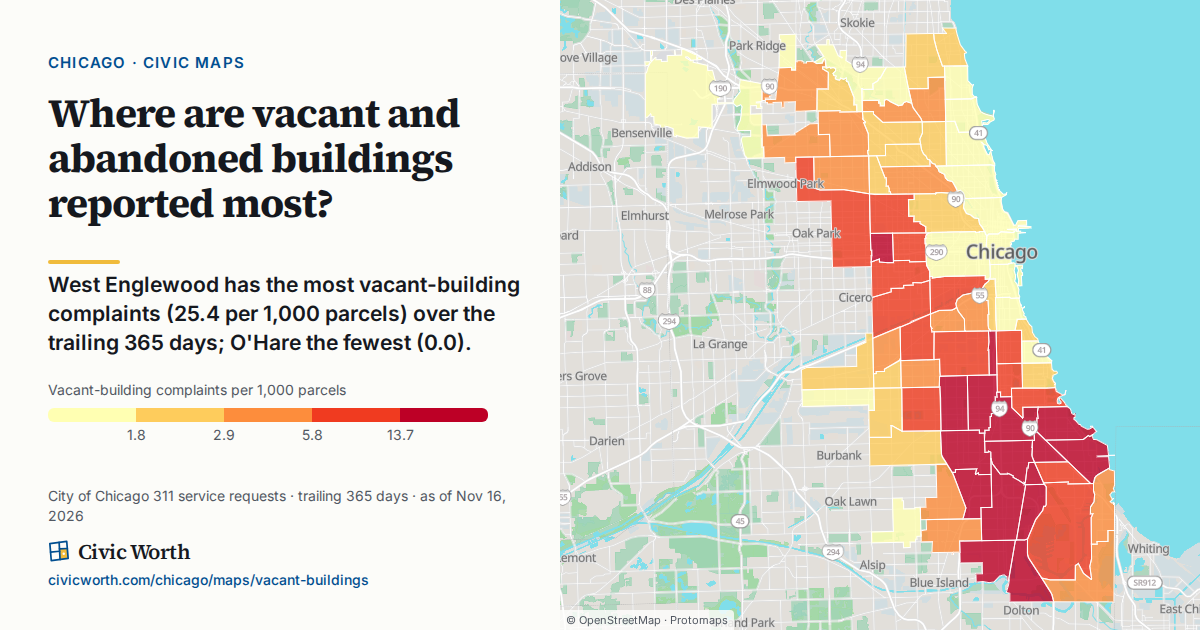
Lincoln Park and the Near North Side are both in that map's ranking of 77 community areas, at 0.7 and 0.6 complaints per 1,000 parcels.
How to read each unit
"Per 1,000 parcels" is a rate
A parcel is a piece of land with its own Cook County Property Index Number. A rate sets a count against the number of parcels and scales it to 1,000, so a ward with many parcels and a ward with few can be compared on the same footing. That is how Ward 2's 41.7 permits per 1,000 parcels can sit next to any of the other 49 wards' figures and mean something.
The same logic applies to 25.4 building-code violations per 1,000 parcels. It is a density of recorded violations, not a verdict on the buildings. Our Columbus piece on what code-complaint numbers say about a neighborhood walks through how counts like these get misread.
The 311 figure is a median, with a filter
A median is the middle value: line up every counted request from fastest to slowest and take the one in the middle. Half closed faster, half slower.
But read the label carefully: "for requests closed within 30 days." Anything that took longer, or is still open, is not in this number. So 0.5 days describes the typical closure among requests that finished inside a month, not every request filed in Ward 2.
"vs city" and "# of 50" are two lenses on one value
The percentage compares Ward 2's value with the citywide figure: +20% on permits, -38% on the 311 median, -47% on code violations.
The rank places Ward 2 among all 50 wards on the same value. Read the rank together with the number and the percentage: #7 of 50 on permits comes with a rate above the city's, while #45 of 50 on the 311 median comes with a median below the city's. Use neutral words when you write it up: highest or lowest rate, shortest or longest median. Never best or worst.
Why a ward number says little about your block
A ward figure is one number for the whole ward. A permit-heavy corner and a quiet residential street both feed the same 41.7. Nothing in that number tells you which kind of block you live on.
That is the job of the second step. Type any Chicago address into the free address preview and the Civic Address Card shows that one parcel: who represents it, how it is zoned, the nearest transit, and the most recent 311 requests nearby. The parcel you stand on, not the ZIP you live in. For a reporter writing about one building or one corner, that is the right resolution. The ward page is the right resolution for a ward.
Sale prices have the same problem at a different scale, which we unpacked in why a $660,000 median in Lincoln Park isn't the whole story.
What to check before you quote it
The Ward 2 page is upfront about its limits, and you should be too:
- It is beta. The page says Civic Worth is in beta, "assembled automatically from public records and can be wrong," and asks you to check the official source before you rely on it.
- It carries the City of Chicago data disclaimer. The City makes no claims as to the content, accuracy, timeliness, or completeness of the data.
- Click through. Each measure has a "See Ward 2 on the map" link. Open it and confirm the as-of date matches what you are quoting.
- Flag errors. The page links a way to tell Civic Worth what is wrong and to see what has been corrected. Submitting a correction flags the parcel as disputed while it is reviewed.
Verified newsrooms and 501(c)(3) nonprofits get 100 reports a month at no cost.
Your next step
Go back to the Vacant & abandoned buildings map above, find Lincoln Park and the Near North Side in the ranking, and note the as-of date before you write a single sentence about them.
Sources
- Civic Worth, Chicago Ward 2
- Civic Worth, Chicago Vacant & abandoned buildings map
- Civic Worth, Chicago property records
- Civic Worth, Columbus code-complaint numbers
- Civic Worth
- Civic Worth, Why a $660,000 Median in Lincoln Park and $71,000 in Riverdale Isn't the Whole Story
- Civic Worth, Methodology
Drafted with AI assistance from public records, and checked against the sources above before publishing.
Frequently asked
What does per 1,000 parcels mean?
It is a rate. A count, such as building permits or code violations, is set against the number of parcels in the area and scaled to 1,000. That puts large and small wards on the same footing, so Ward 2's 41.7 permits per 1,000 parcels (as of Nov 20, 2026) can be compared with each of the other 49 wards rather than just reflecting ward size.
What does 311 median days to close mean in Chicago?
It is the middle closing time among requests, so half closed faster and half slower. On the Ward 2 page it counts only requests closed within 30 days, which means slower or still-open requests are excluded. Ward 2's 0.5-day median, as of Nov 20, 2026, describes a typical closure among requests that finished inside a month, not every request filed in the ward.
How do I look up 311 and zoning for a Chicago address?
Type the address into Civic Worth's free address preview. The Civic Address Card shows who represents that parcel, how it is zoned, the nearest transit and the most recent 311 requests nearby, with no account and no charge. It is the parcel-level step after a ward page, whose figures are for the whole ward and cannot tell you about one block.