311 Complaint Map Chicago: Where Requests Close Within 7 Days, and Where They Wait
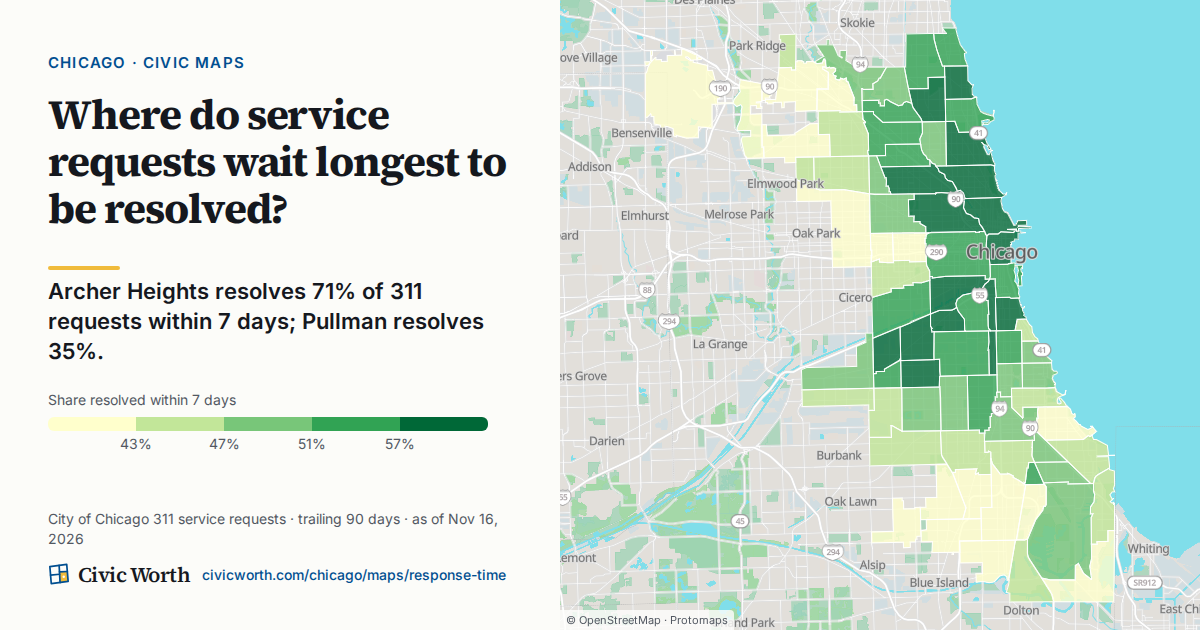
Civic Worth's Chicago 311 response times map shows the share of 311 requests resolved within 7 days by community area: Archer Heights at 70%, West Garfield Park at 34% (City of Chicago 311 service requests, trailing 90 days, as of Nov 20, 2026). Here's how to read and cite it.
Archer Heights resolves 70% of 311 requests within 7 days; West Garfield Park resolves 34%. That is the current finding on Civic Worth's 311 complaint map Chicago residents can search by address (Source: City of Chicago 311 service requests, trailing 90 days, as of Nov 20, 2026).
Two community areas, one measure, and a gap you can read in a sentence. This post explains what that measure is, how to find your own community area on the map, and how to quote it without getting the date wrong.
Open the 311 complaint map chicago and follow along.
What the 311 response times map measures
The map asks one question: where do Chicago service requests wait longest? Its default view shows, for each community area, the share of 311 requests resolved within 7 days, over a trailing 90-day window of City of Chicago 311 service requests.
The share is stricter than it sounds. It counts every request old enough to have had a week, and a request still open past that deadline counts as a miss. So a slow request is counted against the share instead of dropping out of it. Canceled requests are left out, and so are aircraft noise complaints and information-only calls, which are logged, not worked.
Archer Heights sits at 70%. West Garfield Park sits at 34%. The full ranking lists all 77 community areas between them.
The map does not say why a community area ranks where it does, and neither will this post. A map with a date on it beats a hunch without one, but only if you stop where the numbers stop.
Why a share, not a count
A share puts places with many requests and places with few on one scale. Seventy percent means seven in ten counted requests were resolved within a week, whatever the total was. That is how the Loop, at 68%, and Hegewisch, at 41%, can sit on the same ranked list.
Why the 90-day window means the map moves
The window is the trailing 90 days, so each refresh brings in newer requests and lets older ones go. A community area's share can rise or fall as that happens, which is why the finding carries an as-of date. The 70% and 34% above are as of Nov 20, 2026. They describe that window, not a permanent trait of either place.
We wrote about the same discipline for Columbus records in why the as-of date is the whole argument. It applies to Chicago just as much.
How to read the 311 complaint map Chicago residents can search by address
Here is the routine, start to finish.
- Open the map and scroll to the full ranking of all 77 community areas.
- Find your community area. Search your address, or click any area on the map.
- Read its share of requests resolved within 7 days.
- Place it against the list. Is it near the highest share, near the lowest, or somewhere in the middle? Say it that way. "Among the highest shares" or "among the lowest shares" is accurate. "Best" and "worst" are judgments the map does not make.
- Note the as-of date before you write the number down anywhere.
That last step is the one people skip. A share quoted without its window and date is a number floating in space; next month someone will compare it to a newer figure and think something changed when only the window did.
Two more views, and what they count
The map has three views: Resolved in 7 days, Median days to close (within 30), and Still open after 30 days. Still open after 30 days is the share of requests, old enough to have had 30 days, that were still open 30 days after they were filed. Median days to close is the median among the requests that closed within those 30 days, so it describes the ones that finished, not the ones still waiting. Read all three before you describe a place by one of them.
What the share does not tell you
The share covers a whole community area. It is not a verdict on your block, a safety rating, or a prediction of anything about property. Community areas with too few requests show as "insufficient data" rather than a noisy number. For the same limits in another city, see our Columbus explainer on what 311 response times actually measure.
For reporters and nonprofits: how to cite it
If you use a figure from the map in a story, a grant application, or an outreach flyer, cite three things alongside it:
- Source: City of Chicago 311 service requests
- Window: trailing 90 days
- As-of date: the date shown with the finding when you pulled the number
A clean citation looks like this: "West Garfield Park resolves 34% of 311 requests within 7 days (City of Chicago 311 service requests, trailing 90 days, as of Nov 20, 2026)." If your piece runs weeks later, recheck the map. The window will have rolled, and the share may have moved with it.
Verified newsrooms and 501(c)(3) nonprofits get 100 reports a month at no cost.
Second step: one address, not the whole community area
The map tells you about a community area. Sometimes you need to know about one building. For that, the free address preview is the next step: type any Chicago address and the Civic Address Card shows the most recent 311 requests nearby, along with who represents that parcel, how it is zoned, and the nearest transit. No account, no charge. You can start from Chicago 311.
That is the parcel you stand on, not the ZIP you live in. Read it next to your community area's share and you have both the wide view and the close one.
Now go back to the map, find your community area, and write down its share with the as-of date beside it.
Sources
- Civic Worth, Chicago 311 response times map
- Civic Worth, The Date on a Columbus Zoning or District Record
- Civic Worth, What Columbus 311 Response Times Actually Measure
- Civic Worth
- Civic Worth, Chicago 311
Drafted with AI assistance from public records, and checked against the sources above before publishing.
Frequently asked
How do I compare Chicago 311 response times by community area?
Open Civic Worth's Chicago 311 response times map, which ranks all 77 community areas by the share of 311 requests resolved within 7 days over a trailing 90-day window. As of Nov 20, 2026, Archer Heights resolves 70% and West Garfield Park resolves 34% (City of Chicago 311 service requests). Find your community area and read it against the ranked list.
How long does Chicago 311 take to resolve a request?
It varies by community area. The map's default measure is the share resolved within 7 days, not a guaranteed timeline. As of Nov 20, 2026, that share ranged from 70% in Archer Heights to 34% in West Garfield Park, based on City of Chicago 311 service requests over the trailing 90 days. Check your own community area for its current share.
How should I cite Chicago 311 data for my neighborhood?
Quote the share with its source, window, and as-of date: for example, "West Garfield Park resolves 34% of 311 requests within 7 days (City of Chicago 311 service requests, trailing 90 days, as of Nov 20, 2026)." Because the 90-day window rolls forward, recheck the map before publishing if time has passed since you pulled the figure.