How Columbus Plans Development Around Transit, and How to Check Your Address
· Updated
Civic Worth hasn't measured whether bus access predicts development, but Columbus and COTA plan the two together in public, through the Zone In zoning rewrite and the LinkUS transit plan. Here's what those plans say, how COTA defines frequent service, and how to check an address.
Correction (October 3, 2026): An earlier version of this article said parcel-level data shows that bus access predicts which Columbus blocks get new development, repaved streets or sidewalk repairs, but Civic Worth had not measured that and we found no source that shows it. What is documented is that the City and COTA plan development and transit together in public: the City's Zone In zoning rewrite began on the city's primary mixed-use corridors, and LinkUS, created by COTA, the City, Franklin County and the Mid-Ohio Regional Planning Commission, pairs new rapid-transit lines with plans for development around their stations (City of Columbus, August 20, 2026; COTA, LinkUS; LinkUS, Transit-Oriented Development).
The short answer: it's planned in the open
Civic Worth hasn't measured whether bus access, by itself, predicts which Columbus blocks get new buildings or street repairs, and we haven't found a study that shows it for Columbus. What the public record does show is that the City and COTA tie development and transit together on purpose, in documents anyone can read:
- Zone In, the City's zoning-code rewrite, started on the corridors. In August 2026 the City said that two years earlier it "began modernizing its zoning code along 140 miles of the city's primary mixed-use corridors" (City of Columbus, August 20, 2026).
- LinkUS, which COTA calls "our region's proactive transportation and growth plan," adds rapid-transit lines and plans for development around their stations (COTA, LinkUS; LinkUS, Transit-Oriented Development).
Zone In: new zoning along the busiest streets
When the City introduced the first Zone In proposal in April 2024, it recommended "creating six new mixed use zones on 12,300 parcels of land along Columbus' busiest streets" (City of Columbus, April 4, 2024). The same announcement quoted the City Council President calling upzoning along the corridors "an inflection point for Columbus to pivot away from car-centric sprawl and toward a sustainable future of dense, mixed-use, transit-oriented development."
The City says the Phase 2 proposal covers more than 70,000 parcels, roughly 41 percent of the city, and "expands market-driven parking standards to better reflect surrounding building uses and access to transit" (City of Columbus, August 20, 2026). Public comment runs August 25 through October 24, 2026, and the City's timeline lists City Council consideration in the fourth quarter of 2026 (Zone In, Current Proposal). Zone In districts fall under Title 34, a different code from the Title 33 zoning code (what Phase 2 would change for your address).
LinkUS: transit lines with development plans attached
COTA's LinkUS page says the plan was "collaboratively created by COTA, the City of Columbus, the Franklin County Board of Commissioners and the Mid-Ohio Regional Planning Commission (MORPC)." Through it, COTA says it will "Increase service hours by 45%" and "Introduce multiple Bus Rapid Transit (BRT) lines within COTA's service area" (COTA, LinkUS).
The development side is spelled out for the West Broad Street line. LinkUS says its West Broad Corridor Transit-Oriented Development Plan "is focused on encouraging transit-supportive, community-centered growth around each planned BRT station along the 9.3-mile West Broad Street BRT Corridor," and that an intentional strategy there "will allow the City of Columbus and partner localities to encourage development that supports neighborhood needs" (LinkUS, Transit-Oriented Development).
How COTA defines frequent service
COTA's system map sorts its lines into two service levels: Frequent, where "Departure times are every 15 minutes or less," and Standard, where "Departure times are 16–60 minutes apart" (COTA, System Map). A line's level can change. COTA "modifies service three times per year on the first Monday of January, May and September," and those changes "may include modifications to frequency, schedules, trip times, routing or stop locations" (COTA, Service Changes). How a COTA route change happens walks through that process, public meetings included.
COTA's service planning is also published. Its Short-Range Transit Plan page offers "the insights, data and tools that guide our decisions," including dashboards that show "how population, jobs, travel patterns and existing COTA services come together" (COTA, Short-Range Transit Plan).
What the transit-access map shows
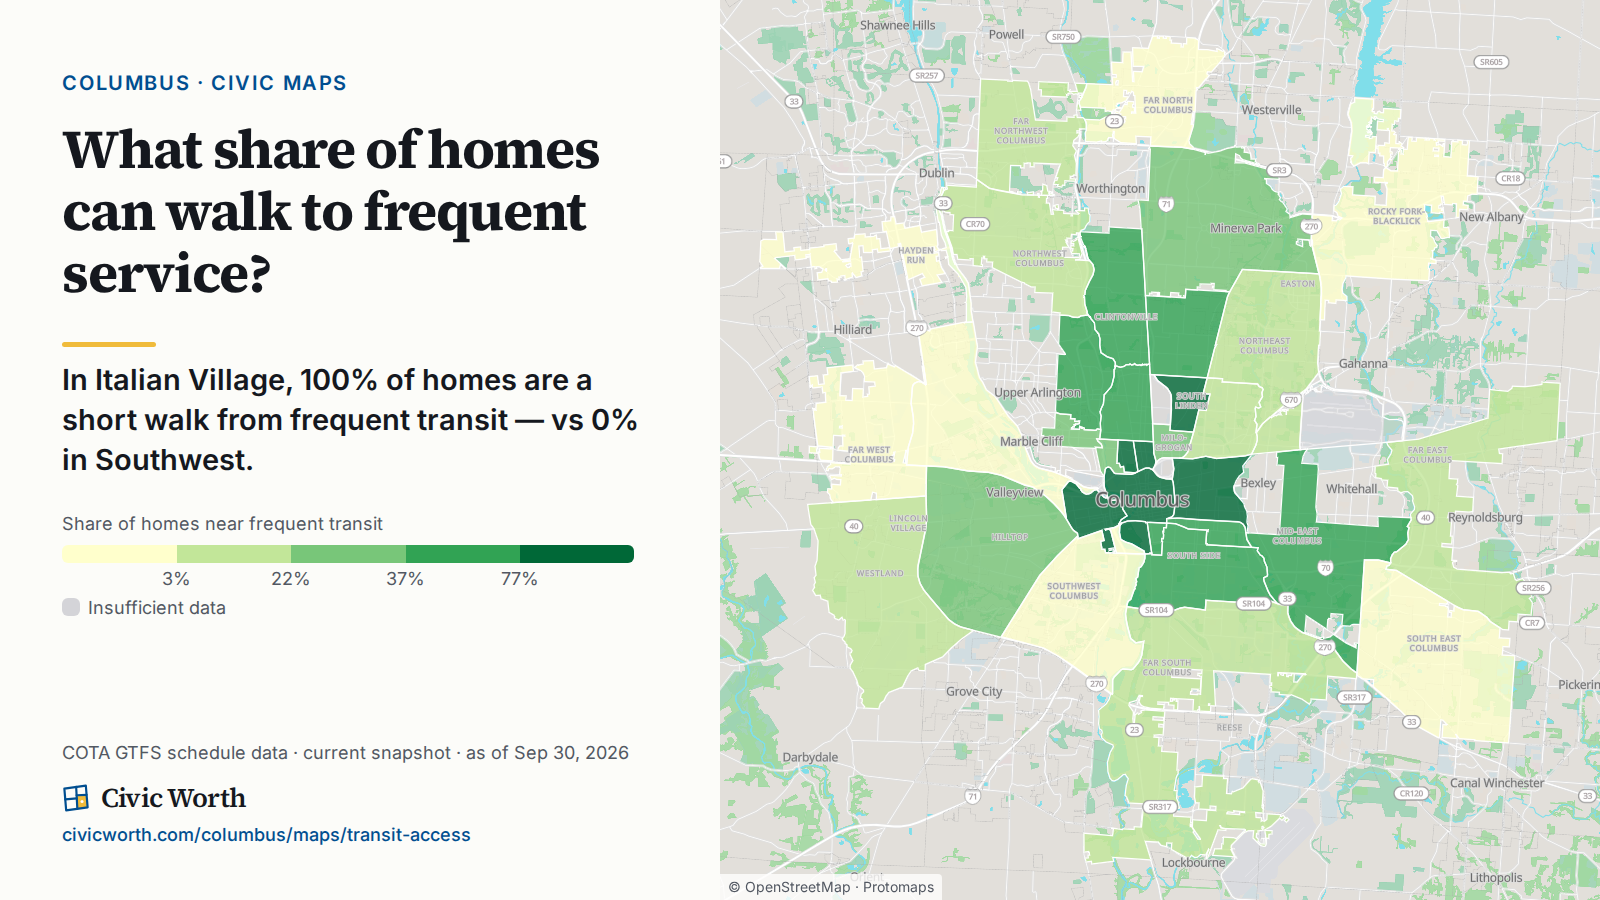
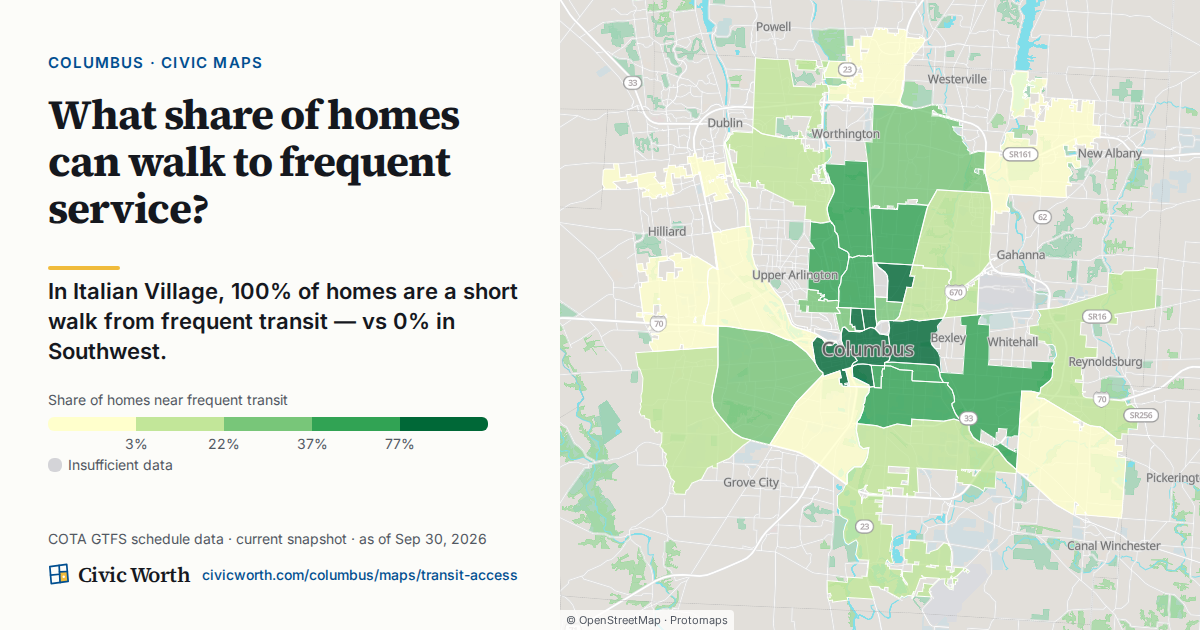
The map above reports, for each neighborhood, the share of homes within about a 400-meter (quarter-mile) walk of a COTA stop that runs at least every 15 minutes at peak, built from COTA's published schedule data. As of October 3, 2026, Italian Village, Victorian Village and the Brewery District are at 100%, Southwest is at 0%, and the citywide figure is 24%. Distance is measured in a straight line, so the map "can slightly overstate access where a river, rail line, or highway blocks the walk." Its neighborhoods are the City's Columbus Communities planning areas, which the City notes aren't a substitute for area commission boundaries.
Check an address
Civic Worth's free address preview shows the nearest transit stop, the zoning district (labeled Title 33 or Title 34), building permits within 200 meters over the past 24 months and 311 requests within 200 meters over the last 30 days (up to 25 of each), each with its source and an as-of date. For Zone In Phase 2, the free Zone In Decoder compares the current Title 33 district with the proposed Title 34 district. For a separate measure of construction, the Development pulse map asks "Where is construction and investment money flowing?"
What this can't tell you
Two maps side by side show two measures, not a cause, and Civic Worth hasn't tested whether frequent transit leads to more permits or repairs. Zone In and LinkUS describe plans, not what will get built. If you're reporting on this, cite the plan documents for intent and the City's own building permit records for what was built. Verified newsrooms and 501(c)(3) nonprofits get 100 reports a month free (details).
To weigh in: comment on Zone In Phase 2 before October 24 (how to comment), or attend one of COTA's public meetings on proposed service changes (COTA, Service Changes).
Sources
- City of Columbus, Columbus Introduces Zoning Code Proposal Capable of Creating 88,000 Housing Units (April 4, 2024)
- City of Columbus, Columbus Continues Historic Zoning Code Modernization with New Proposal for Nearly Half the City (August 20, 2026)
- City of Columbus, Zone In: Current Proposal
- COTA, LinkUS
- LinkUS, Transit-Oriented Development
- COTA, System Map
- COTA, Service Changes
- COTA, Short-Range Transit Plan
- COTA, Data (GTFS)
- City of Columbus GIS, Building and Zoning layers, including Building Permits
Frequently asked
Does bus access predict which Columbus neighborhoods get development?
Civic Worth hasn't measured that, and we haven't found a study that shows it for Columbus. What is documented is that the City and COTA plan the two together: Zone In began by rezoning along the city's primary mixed-use corridors, its Phase 2 draft sets parking standards that reflect "access to transit" (City of Columbus, August 20, 2026), and LinkUS plans development around new rapid-transit stations (LinkUS, Transit-Oriented Development).
What counts as frequent COTA service?
COTA's system map calls a line Frequent when "Departure times are every 15 minutes or less" and Standard when "Departure times are 16–60 minutes apart" (COTA, System Map). Civic Worth's transit-access map counts a home as near frequent transit when it is within about 400 meters of a stop that runs at least every 15 minutes at peak.
How can I see transit access for my address?
Civic Worth's free address preview shows the nearest transit stop and the zoning district, labeled Title 33 or Title 34, each with its source and an as-of date. The transit-access map shows the share of homes near frequent service in your neighborhood, built from COTA's published schedule data (COTA, Data).